
Creating content can feel like shouting into the void. You spend hours writing, editing, and publishing, but are you sure anyone is listening? More importantly, are the right people listening? Instead of relying on hunches, you need concrete data to guide your strategy. This is where Google Analytics comes in. It’s the tool that shows you what’s working, what isn’t, and why. Understanding how to use Google Analytics for content marketing means you can stop guessing and start making informed decisions that drive real results. This guide will walk you through the essential reports and metrics to transform your content from a shot in the dark into a data-driven engine for growth.
Key Takeaways
- Measure Content's True Business Impact: Go beyond traffic numbers by tracking engagement rates and conversions. This shows you which articles are not just popular, but are actively contributing to your business goals.
- Let User Behavior Guide Your Strategy: Analyze how visitors interact with your site using reports like Path Exploration and Site Search. This data reveals what your audience wants, helping you fill content gaps and improve the user journey.
- Connect Google Analytics to Search Console: Integrate these two tools to see which organic keywords drive the most valuable traffic. This allows you to focus your SEO efforts on terms that attract an engaged and converting audience.
What is Google Analytics for Content Marketing?
Google Analytics is a web analytics service that tracks and reports website traffic. For content marketers, it’s an essential tool for understanding how people find and interact with your website. It collects user data to give you a clear picture of your audience and their behavior, helping you make informed decisions that refine your marketing strategy and improve your site’s performance.
Think of Google Analytics as a compass for your content. It shows you which blog posts resonate with your audience, where your readers are coming from, and what actions they take after reading. Instead of guessing what works, you can use concrete data to see which topics generate the most traffic, which pages keep users engaged the longest, and which content leads to conversions. This allows you to create more of what your audience loves and build a content plan that directly supports your business goals.
The role of Google Analytics in your strategy
Google Analytics provides the insights you need to make data-driven marketing decisions. It helps you move beyond simple metrics to understand the real impact of your content. By tracking user acquisition and behavior, you can see which channels drive the most valuable traffic and how different audience segments interact with your site.
The current version, Google Analytics 4 (GA4), measures performance using an event-based model. Unlike its predecessor, which was session-based, GA4 tracks every user interaction—like a page view, scroll, or click—as a distinct event. This approach gives you a more flexible and detailed view of the user journey, making it easier to measure your content marketing effectiveness from start to finish.
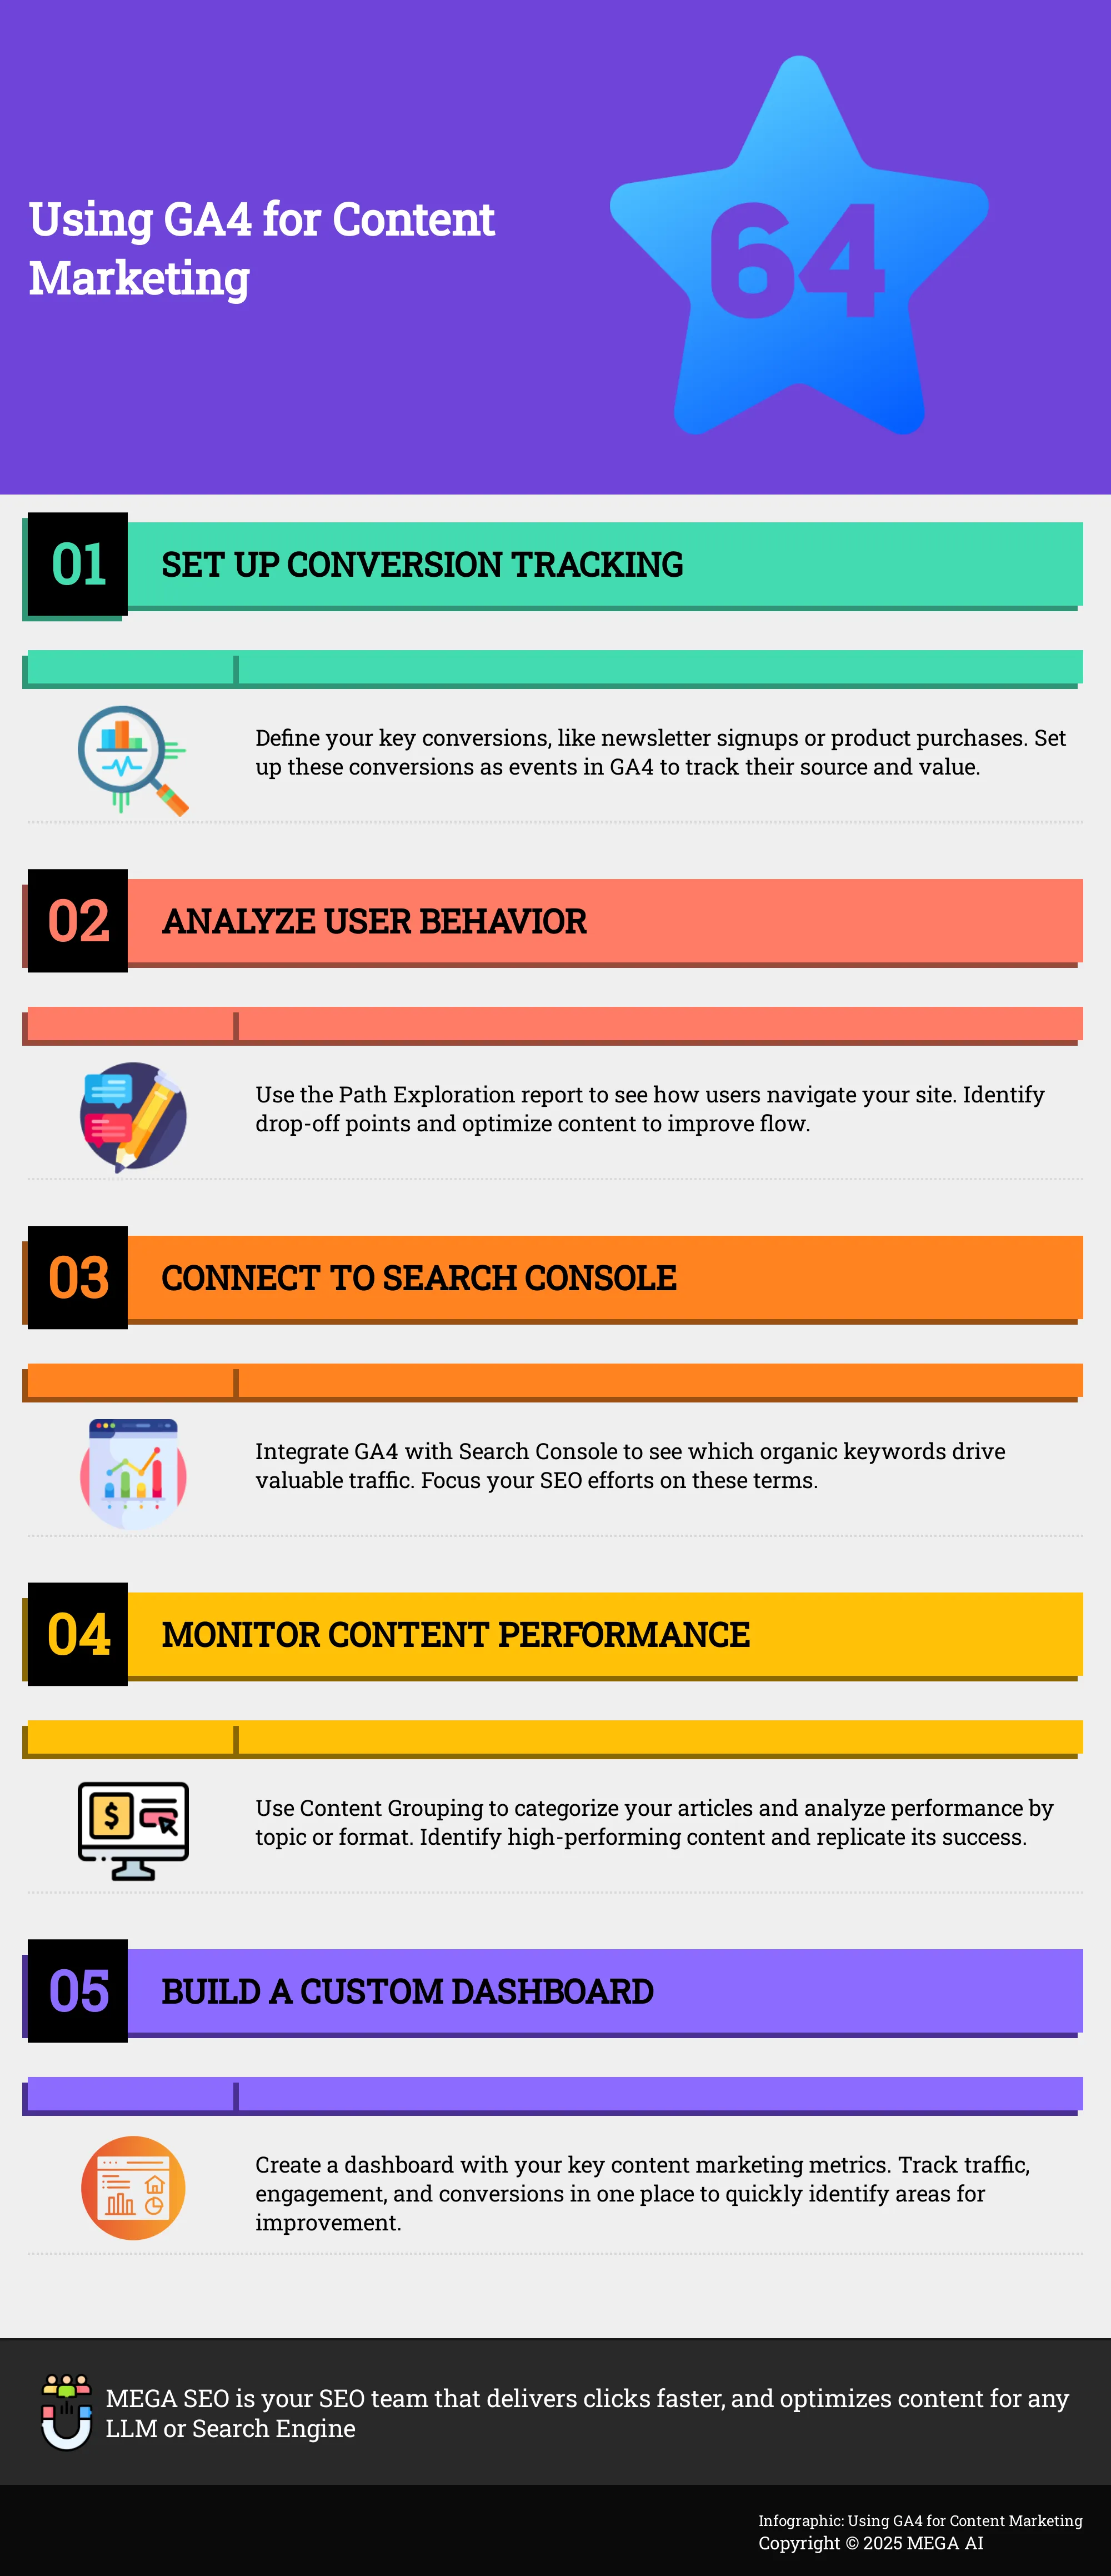
Key benefits for content marketers
Analyzing your content with Google Analytics helps you understand your audience on a deeper level. This understanding allows you to create more effective marketing campaigns, build stronger brand loyalty, and achieve a better return on your investment. When you know which content performs best, you can double down on successful topics and formats to continuously improve your content strategy.
Google Analytics offers a huge amount of data, but its true value comes from knowing how to apply it. By focusing on the right metrics, you can identify what’s working, find areas for improvement, and prove the value of your content efforts. The key is to learn how to use it effectively to turn raw data into actionable insights that guide your content creation process.
How to Set Up Google Analytics for Content Tracking
Before you can analyze your content's performance, you need a solid foundation. Setting up Google Analytics correctly from the start ensures you collect clean, accurate data. This process involves creating an account and then fine-tuning a few key settings to align with your content marketing goals. Getting this right means you can trust the insights you gather later on.
Create an account and install the tracking code
First things first, you need to create a Google Analytics account if you don't have one already. This is your central hub for all website data. Once your account is ready, Google will provide a small piece of JavaScript known as the tracking code. This code snippet must be placed on every single page of your website. It works in the background to collect information about how users find your site and what they do once they arrive. Installing this code correctly is critical; without it, Google Analytics can't see your traffic or track user interactions, leaving you in the dark about your content's effectiveness.
Configure settings for content analysis
With the tracking code installed, your next step is to configure your settings for meaningful content analysis. This goes beyond just collecting data; it’s about telling Google Analytics what success looks like for your business. Start by defining key events, which are specific user actions that you consider valuable, like a newsletter signup or a contact form submission. You can also use advanced features like Content Grouping to organize your posts by topic, author, or format. This allows you to compare the performance of different content categories, helping you see which themes resonate most with your audience and drive the best results.
Which Content Metrics Should You Track?
Once you have Google Analytics set up, you'll find a sea of data at your fingertips. It can feel overwhelming, but the key isn't to track every single metric available. Instead, focus on the ones that truly reflect your content marketing goals. Choosing the right metrics helps you understand what’s working, what isn’t, and where to focus your efforts. This data-driven approach moves you from guessing to knowing, allowing you to create content that genuinely connects with your audience and supports your business objectives.
Think of these metrics as the vital signs of your content's health. They tell you how many people are seeing your content, how they're interacting with it, and whether it's inspiring them to take the actions you care about, like signing up for a newsletter or making a purchase. By regularly monitoring a core set of metrics, you can spot trends, identify your top-performing articles, and find opportunities for improvement. This is the foundational work that makes strategic optimization possible. For instance, identifying a page with high traffic but low engagement can signal a need to update the content for better relevance or a higher click-through rate, a process that can be streamlined with tools like MEGA AI's Maintenance Agent. This focus on meaningful data ensures your resources are spent creating content that delivers real value.
Traffic and engagement
Your first stop should be traffic and engagement metrics, which give you a baseline understanding of your content's reach and appeal. Page Views show you which specific posts are the most popular, while Users tells you how many unique individuals are visiting your site.
With Google Analytics 4 (GA4), the focus has shifted toward measuring interaction more accurately. Key metrics to watch are Engaged Sessions—visits that last longer than 10 seconds, have a conversion, or include at least two pageviews—and the overall Engagement Rate. A high engagement rate is a strong signal that your content is capturing and holding your audience's attention. Understanding this GA4 terminology is fundamental to evaluating how well your content resonates.
Conversions and acquisition
While traffic is important, conversions tell you if your content is driving business results. A conversion is any action you want a user to take, from filling out a form to buying a product. To measure this, you need to set up goals in Google Analytics.
Once goals are configured, the Page Value metric becomes incredibly useful. It assigns an average monetary value to a page based on the conversions that happened after a user visited it. This helps you identify which content pieces are most effective at contributing to your revenue. By focusing on what makes these high-value pages successful, you can refine your strategy and measure the success of your content marketing in concrete terms.
Content performance
To get a true sense of content performance, you need to look at trends over time. A blog post might not get much traction in its first week, but it could gain momentum over months as its SEO authority builds. Always compare content using the same timeframes for an accurate, apples-to-apples comparison.
For a more granular view, use GA4's Content Grouping feature to categorize your content by topic, format, or author. This helps you see which categories perform best. You can also build custom reports in the Explorations section to visualize data in ways that are most meaningful to your business. These advanced features provide deeper insights into how your content is performing and highlight specific areas for improvement.
How to Analyze User Behavior to Improve Content
Getting traffic to your content is only the first step. To truly succeed, you need to understand what visitors do once they arrive. Analyzing user behavior shows you which topics resonate, where readers get stuck, and what paths they take through your site. This information is a goldmine for refining your content strategy, improving user experience, and guiding your audience toward your goals. When you know how people interact with your pages, you can optimize everything from your internal linking to your calls-to-action.
Google Analytics provides the raw data you need to see how people interact with your website. By digging into behavior reports, you can move beyond simple page views and start answering critical questions. Are users reading your articles and then leaving, or are they clicking on internal links to learn more? Are they finding what they need through your site’s search bar? The answers help you make informed decisions, ensuring every piece of content you create serves a clear purpose and delivers value to your audience. This data-driven approach removes the guesswork from content creation and helps you build a site that truly serves your visitors.
Use behavior reports and user flow
Behavior reports in Google Analytics are your window into how users engage with your content. The Pages and Screens report, for example, shows you which pages are most popular, how long users spend on them, and how many events are triggered. This helps you identify your top-performing content so you can create more of what works. You can also spot underperforming pages that may need to be updated or promoted differently.
To see the bigger picture, use the Path Exploration report. This tool visualizes the journey users take from one page to the next, revealing common pathways and drop-off points. If you see many users exiting from a specific page, it might indicate that the content isn’t meeting their needs or that the next step isn’t clear. By learning how to customize reports, you can tailor your analysis to focus on the specific user journeys that matter most to your business goals.
Track internal links and interactions
Tracking how users interact with elements on your page gives you a deeper layer of insight. Clicks on internal links, for instance, tell you if your content is successfully guiding users to other relevant information on your site. A strong internal linking strategy not only improves user engagement but also helps search engines understand the structure and hierarchy of your content, which is great for SEO. If users aren't clicking your links, you may need to make your anchor text more compelling or your calls-to-action more prominent.
Beyond links, you can track other key interactions like video plays, file downloads, or clicks on call-to-action buttons. GA4’s event-based model makes it simple to measure these specific actions. This data reveals what users find most valuable on a page, helping you improve your content and optimize its layout to encourage the right kinds of engagement.
Use site search data for topic ideas
Your website’s internal search bar is a direct line to your audience’s needs. The Site Search report in Google Analytics shows you the exact terms people are typing when looking for information on your site. This is an invaluable source of inspiration for new content. If you see users repeatedly searching for a topic you haven’t covered, you’ve just identified a proven content gap that you can fill.
This data also helps you refine your existing content and navigation. If people are searching for something you already have, it might mean the content is hard to find. Analyzing what works and what doesn’t allows you to create more effective marketing campaigns and build a better user experience. By paying attention to what your audience is telling you through their searches, you can ensure your content strategy is always aligned with their interests.
How to Measure and Optimize Content Performance
Creating great content is only half the battle. To truly succeed, you need to know what’s working and what isn’t. This is where measuring and optimizing performance comes in. Google Analytics provides the data you need to make informed decisions, turning good content into high-performing assets. The key is to move from simply collecting data to using it for continuous improvement. This ongoing process of analysis and refinement ensures your content stays relevant and effective, which is exactly what tools like MEGA AI's Maintenance Agent are designed to automate.
Use content drilldown and landing page reports
To find out which specific pieces of content are resonating with your audience, start with the landing page reports in Google Analytics. You can find this report under Reports > Engagement > Landing page. This view shows you the first page a visitor lands on, giving you a clear picture of your most effective entry points. Look for pages with high traffic but low engagement rates or conversion numbers. These are prime candidates for an update. By analyzing which pages draw users in, you can double down on successful topics or formats and re-optimize underperforming content to better meet user intent.
Implement content groupings for clearer analysis
If you publish a lot of content, looking at individual page performance can be overwhelming. Content grouping allows you to categorize your content for a higher-level analysis. For example, you can group pages by topic (like "SEO" vs. "Paid Ads"), format (blog posts vs. case studies), or author. This feature provides deeper insights into which categories drive the most traffic and engagement. Setting up content grouping in GA4 helps you identify broad trends in your content strategy, making it easier to decide where to invest your resources for the biggest impact. It answers the question, "What type of content does my audience value most?"
Monitor site speed and its effect on engagement
Page speed is a critical factor for both user experience and SEO. A slow-loading page can cause visitors to leave before they even read your first sentence. Google Analytics can help you monitor your site's performance by tracking Core Web Vitals, such as how quickly your main content loads. By connecting site speed data with engagement metrics, you can see a direct correlation between slow pages and high bounce rates. Regularly check your site speed reports and prioritize optimizing your most important pages. Improving technical performance is a foundational step that makes all your other content marketing efforts more effective.
Use Audience Insights to Refine Your Content Strategy
Creating content without knowing your audience is like talking into an empty room. Google Analytics acts as your eyes and ears, showing you exactly who is listening. By looking at audience data, you can move from making assumptions to making data-driven decisions about your content. This means creating articles, videos, and guides that your audience actually wants to read and share.
GA4 offers a detailed picture of your visitors, including their age, location, interests, and how they interact with your site. When you understand these characteristics, you can fine-tune your content strategy to match their needs and preferences. This alignment is key to improving engagement, building a loyal following, and ultimately, driving more conversions. The following sections will show you how to use specific reports in Google Analytics to get to know your audience on a deeper level and use that knowledge to create more effective content. With a platform like MEGA AI, you can take these insights and automatically generate content that speaks directly to your target segments.
Analyze demographic and geographic data
Knowing who your audience is and where they come from is the first step to creating relevant content. Google Analytics provides this information in its demographic and geographic reports. You can find these by going to the Reports section and looking under User > User attributes. Here, you’ll see data on your audience's age, gender, city, and country.
Imagine you discover that a significant portion of your traffic comes from a non-English-speaking country. This insight could prompt you to translate key content or create region-specific campaigns. Similarly, if your data shows your primary audience is in the 25-34 age range, you can adjust your content's tone and cultural references to better connect with them. This is how you use demographic data to target your audience more effectively.
Understand user interests and behaviors
Beyond demographics, you need to understand what your audience is passionate about and how they behave on your site. GA4's interest reports (found under User attributes > Demographics details) reveal your audience's affinity categories, showing their general lifestyle interests like "Tech Enthusiasts" or "Foodies." This helps you find new content angles that align with their passions.
To understand behavior, focus on key engagement metrics. An Engaged Session is one that lasts over 10 seconds, has a conversion, or includes at least two pageviews. A high Engagement Rate on certain pages tells you which topics resonate most. By analyzing these metrics, you can identify your most compelling content and create more of what works, ensuring your strategy is always aligned with what your audience finds valuable.
Tailor content for new vs. returning visitors
Not all visitors are the same. New users need an introduction to your brand, while returning visitors are ready for a deeper dive. Google Analytics allows you to create comparisons to see how these two groups behave differently. You can compare metrics like pages per session, engagement rate, and conversions for new versus returning users.
Use this data to build a better user journey. For new visitors, focus on creating welcoming, top-of-funnel content like introductory blog posts or "getting started" guides. For your returning audience, offer more specific, in-depth content such as advanced tutorials, case studies, or exclusive offers. This tailored approach helps you nurture new leads while keeping your loyal audience engaged and moving through the marketing funnel.
How to Use Google Analytics for SEO
While Google Search Console tells you how your site performs in search results, Google Analytics tells you what users do once they arrive. Combining insights from both platforms is essential for a well-rounded SEO strategy. Using Google Analytics, you can move beyond simple rankings and impressions to understand if your SEO efforts are attracting the right audience—the one that engages, converts, and comes back for more.
Google Analytics provides valuable information about your website that you can use to guide your campaigns and assess your marketing efforts. By digging into the data, you can see which content resonates most with organic visitors, which keywords bring in high-quality traffic, and where you have opportunities to create new content that meets user needs. This process helps you refine your content strategy to not only attract visitors but also to provide them with a valuable experience that supports your business goals. For businesses looking to scale, SEO automation tools can handle this analysis, turning complex data into clear, actionable steps.
Track organic search performance
To understand how your SEO is performing, you first need to isolate your organic search traffic. In Google Analytics, you can do this by navigating to the acquisition reports and filtering for the "Organic Search" channel. This view shows you only the visitors who found your site through a search engine like Google, without clicking on an ad.
Once you’ve filtered for organic traffic, look at key engagement metrics like engaged sessions, average engagement time, and conversions. Are organic visitors staying on your site longer than visitors from other channels? Are they viewing more pages? Are they completing key actions, like signing up for a newsletter or making a purchase? Answering these questions helps you determine the quality of your organic traffic and the effectiveness of your content at meeting user expectations. Tracking this organic search performance over time will show you the true impact of your SEO work.
Analyze your top-performing keywords
While Google Analytics famously hides most organic keyword data under the label "(not provided)," you can unlock these insights by connecting your account with Google Search Console. This integration pipes valuable query data directly into your Analytics reports, allowing you to see which search terms are driving clicks and impressions to your site.
With this connection active, you can go beyond just seeing which keywords bring in traffic. You can analyze which queries lead to the highest engagement rates, the most conversions, and the lowest bounce rates. For example, you might find that a keyword with lower traffic volume actually brings in more qualified leads than a high-volume, generic term. This information is critical for prioritizing your content optimization efforts. You can connect Search Console to GA4 to start gathering this data and focus on the keywords that attract an engaged audience.
Identify content gaps and opportunities
Google Analytics is a powerful tool for discovering what your audience wants and where your content strategy is falling short. Analyzing your content helps you understand your audience better and create more effective marketing campaigns. Start by looking at your top landing pages for organic traffic. These are the pages that serve as the primary entry point for search users, and their topics are clearly resonating with your audience.
Next, check your Site Search report. This report shows you what users are typing into the search bar on your website. If people are searching for topics you don't have content for, you’ve just found a clear content gap. These search terms are direct requests from your audience, giving you a ready-made list of ideas for new articles or pages. A thorough content gap analysis can also reveal topics your competitors rank for that you don't, providing another source of high-intent content ideas.
Create Custom Reports and Dashboards
Google Analytics is packed with data, but you don’t need to see all of it every time you log in. Sifting through standard reports to find the metrics that matter to your content strategy can be time-consuming and a little overwhelming. Custom reports and dashboards solve this by letting you create a single, focused view of your most important content marketing KPIs. Think of it as your personal command center, designed to give you a quick, clear snapshot of what’s working and what isn’t, without the distraction of irrelevant data points.
Instead of getting lost in the weeds, you can build a dashboard that surfaces key information about traffic, engagement, and conversions for your top content. This tailored approach helps you move from data collection to decision-making much faster. By focusing only on the metrics tied to your goals, you can spot trends, measure the impact of your efforts, and share progress with your team without any extra noise. It’s about making the data work for you, not the other way around. This customization is essential for anyone who wants to prove the value of their content marketing and make informed choices about where to invest their time and resources next.
Build a content-focused dashboard
A content dashboard pulls all your essential metrics into one place. You can build simple custom reports directly in GA4 or use Looker Studio to create more visual and shareable dashboards. Start by adding widgets for core metrics like Users, Sessions, Engagement Rate, and Conversions. Then, configure them to show data for your top landing pages so you can see which articles or blog posts are driving results.
For a more organized view, use Content Grouping to categorize your content by topic, format, or funnel stage. This allows you to analyze the performance of entire categories at a glance—for example, you can compare how your "how-to" guides perform against your "case studies." This setup gives you a high-level overview that’s perfect for quick check-ins.
Set up automated reports for regular insights
Once your dashboard is built, you don’t have to remember to check it every day. Set up automated reports to have performance snapshots sent directly to your inbox. You can schedule these reports to run weekly or monthly, giving you and your team a consistent pulse on your content’s performance without adding another manual task to your to-do list. This practice helps you regularly review your data and stay accountable to your goals.
Automated reports are great for identifying long-term trends and catching performance dips before they become major issues. When you receive these regular insights, you can act on them quickly. For instance, if a report shows a key article’s traffic is declining, you can use an SEO tool to update it with fresh content and improve its ranking.
Use Advanced Features for Deeper Insights
Once you're comfortable with the standard reports, you can dig deeper into your content's performance with some of GA4's advanced features. These tools move beyond surface-level metrics like pageviews and give you a much clearer picture of how users actually interact with your content. By setting up more specific tracking, you can gather data that is tailored to your unique business goals. This allows you to make smarter, more effective decisions for your content strategy.
Implement event tracking for key interactions
Pageviews tell you if someone landed on your content, but they don't tell you what they did next. That’s where event tracking comes in. Events are specific user interactions you can define and measure, like clicks on a call-to-action button, video plays, or form submissions. For example, you can track how many people click the "Download Now" button on a case study or how far down they scroll on a long-form article. This data provides valuable insight into user behavior, showing you exactly which elements of your content are capturing attention and driving action. Setting up key events helps you measure the interactions that truly matter to your business.
Use custom dimensions and metrics
While GA4 offers many standard dimensions and metrics, you can create your own for more detailed analysis. Think of custom dimensions as extra categories for sorting your data, like "Author Name," "Content Format," or "Post Category." Custom metrics let you measure specific actions that are important to your business goals, such as "Ebook Downloads" or "Affiliate Link Clicks." Using custom dimensions and metrics allows you to ask very specific questions of your data. You could compare the performance of different authors or see which content format generates the most leads, giving you a much more granular view than the default reports allow.
Turn analytics data into an actionable strategy
Collecting data is only half the battle; the real value comes from using it to inform your strategy. By analyzing user engagement metrics, you can identify trends and adjust your content plan to create more of what works. For instance, if your data shows that "how-to" guides receive the most engagement and lead to the most newsletter sign-ups, your action is clear: produce more guides. If a particular topic consistently drives high organic traffic, you can optimize existing content around that theme or develop a content cluster to establish your authority. This data-driven approach ensures your efforts are focused on creating content your audience genuinely prefers and that aligns with your business objectives.
Solve Common Google Analytics Challenges
Google Analytics is a powerful tool, but it's easy to get lost in the data or draw the wrong conclusions. Even experienced marketers can run into challenges that lead to confusion instead of clarity. The key is to be aware of common pitfalls and have a clear plan for how you’ll use the information you gather. By approaching your analytics with a specific purpose, you can turn raw numbers into a roadmap for content that truly connects with your audience and supports your business goals. Let's look at how to overcome two of the most frequent hurdles.
Address common data interpretation issues
Failing to spot and fix common mistakes in Google Analytics can lead to misguided marketing strategies and wasted resources. One of the biggest issues is analyzing data without first setting clear objectives. If you don’t know what success looks like for a piece of content—is it newsletter sign-ups, demo requests, or time on page?—it’s nearly impossible to know if it’s performing well. Another frequent problem is the misinterpretation of traffic sources. If you aren't tracking your marketing campaigns with custom UTM parameters, traffic from an email newsletter might get lumped in with "Direct" traffic, skewing your understanding of what channels are actually driving visitors to your site. Taking the time to set up goals and track campaigns correctly provides a solid foundation for accurate analysis.
Apply data effectively to your strategy
Collecting data is only half the battle; the real value comes from applying it to your content strategy. Google Analytics shows you who is visiting your website and what they do when they get there, which is critical for tailoring marketing strategies to meet your audience’s needs. Regularly reviewing your analytics helps you spot patterns and identify areas for improvement. For example, you might notice a blog post has high traffic but a low conversion rate. This insight allows you to adjust your content, perhaps by adding a stronger call-to-action or more relevant internal links. By consistently checking your data, you can ensure your marketing efforts remain aligned with audience behavior and that your content is optimized to perform.
Related Articles
- Content Analytics Best Practices for 2025
- Harnessing the Power of Google Analytics for Enhanced SEO Strategies - MEGA SEO | Blog
- How to Use Google Analytics to Track Blog Performance
- Website Traffic Content: The Ultimate Guide to Driving Leads
- Keyword Research Using Google Analytics: Easy Guide
Frequently Asked Questions
I'm new to Google Analytics. What's the first metric I should focus on for my content? If you're just starting, begin with the Engagement Rate. This metric tells you what percentage of your visitors actively interacted with a page. It's a much better indicator of content quality than simple page views because it shows that your content is compelling enough to hold someone's attention, which is the first step toward any business goal.
How can I tell which content is actually helping my business goals, not just getting views? To connect content to business results, you need to track conversions. First, define what a conversion means for you, such as a newsletter signup or a form submission, and set it up as an event in Google Analytics. Then, you can see which pages contribute most to these actions. This helps you understand which content is just popular versus which content is genuinely valuable to your business.
My site has an internal search bar. How can I use that data to improve my content? The Site Search report is one of the most useful tools for content ideas. It shows you the exact words and phrases your audience is using to find information on your website. If you see people repeatedly searching for a topic you haven't covered, you've found a clear content gap. This data gives you a direct look into your audience's needs, helping you create content you know they are already looking for.
How often should I be looking at my content analytics? There's no need to check your data every day, as traffic can fluctuate. A good rhythm is to check in weekly to spot any major changes or emerging trends with your content. Then, conduct a more thorough review monthly or quarterly to analyze performance against your goals and make strategic decisions about what to create or update next.
What's the difference between using Google Analytics and Google Search Console for SEO? Think of it this way: Google Search Console tells you how your site performs on the search results page, showing you which keywords people used to find you and how many times your site appeared. Google Analytics tells you what happens after someone clicks through to your website, showing how they engaged with your content and whether they converted. You need both for a complete picture of your SEO performance.