
Relying on your site-wide average position in Google Search Console is like assessing your company’s financial health by only looking at total revenue. It hides the full story. You might have a great average position of 5.0, but if that’s driven by branded searches while your high-intent keywords are stuck on page three, you have a problem. The real insights are in the details. To get a clear picture of your performance, you must segment your data. This guide shows you how to move beyond that single metric and analyze your rankings to reveal your true strengths and weaknesses.
Key Takeaways
- View Average Position as a directional guide: This single number is a blended average of all your rankings, which can mask the real performance of the keywords that actually drive your business.
- Analyze position with other metrics for the full story: A ranking is only valuable if it drives traffic. Always look at position data next to clicks, impressions, and CTR, and filter by specific pages or queries to find meaningful insights.
- Track trends for keywords that matter: Instead of reacting to daily fluctuations, monitor the position of your most important keywords over several weeks or months. This long-term view shows whether your strategy is working and helps you pinpoint content that needs attention.
What Is Average Position in Google Search Console?
When you open Google Search Console, the Average Position metric often stands out. It seems like a straightforward grade for your SEO efforts—a single number telling you where you rank. However, this metric is more complex than it appears and can be easily misinterpreted. Understanding what it truly represents, how it's calculated, and the common pitfalls associated with it is the first step toward using it effectively. Instead of taking it at face value, it's better to see it as one piece of a much larger performance puzzle.
What the Average Position Metric Really Shows
Average Position is the average ranking of your website's URLs for a query or a set of queries. If your site appears for a search, Google notes its position and averages it with all other positions where it appeared for that same search. It’s important to remember this is an average, not a static rank. Your position can fluctuate every time someone searches, and this metric tries to capture the typical placement. While it gives you a general idea of your visibility, many SEO professionals agree that the number itself isn't always useful without additional context from other metrics like impressions and clicks.
What Is a Good Average Position?
Asking for a "good" average position is a bit like asking for the "right" price for a car—it depends on many factors. While there are general benchmarks, a valuable position is ultimately one that helps you achieve your business goals. A top-three ranking for a low-value keyword might be less useful than a position of eight for a term that brings in qualified leads. The key is to move beyond a single number and understand what different positions mean for your visibility and traffic potential. This context helps you set realistic goals and measure progress effectively.
Benchmarks for Success
Generally, an average position between 1 and 10 is the first goal, as this means your site appears on the first page of Google's search results. Most users never go to the second page, so first-page visibility is critical. Within that range, an average position between 1 and 3 is considered excellent because it places you in the most prominent spots, which receive the majority of clicks. However, the value of your position is tied directly to the search intent behind the query. Ranking on the first page for terms your ideal customers are searching for is what truly drives meaningful traffic and business growth.
Why Average Position is a Leading Indicator
Think of average position as a leading indicator of your SEO health. It shows you the average spot your pages appear in search results, giving you an early look at whether your strategy is working. For example, if a page ranks at position 2 for one query and position 8 for another, its average position is 5. An improving trend in this metric over time suggests your content optimizations are gaining traction with Google, even before you see a significant change in clicks. Monitoring this trend helps you confirm you're on the right path and can predict future traffic growth.
Defining Key Metrics: Impressions and Clicks
Your average position tells you where you rank, but it doesn't tell you how many people see your listing or click on it. To get the full picture, you must analyze your position alongside two other critical metrics: impressions and clicks. Impressions measure your visibility, while clicks measure engagement. Understanding the precise definition of each helps you interpret your Google Search Console data correctly and identify opportunities to turn visibility into valuable website traffic. These metrics work together to tell a complete story about your search performance.
What Counts as an Impression?
An impression is counted anytime a link to your site appears in a search result for a user. According to Google, this happens even if the result is "below the fold," meaning the user didn't scroll down far enough to see it. An impression represents an opportunity—a chance for your website to be seen and chosen. A high number of impressions means your content is relevant enough for Google to show it frequently for certain queries. If those impressions aren't leading to clicks, it could mean your ranking is too low on the page or your page title and meta description aren't compelling enough to attract attention.
What Counts as a Click?
A click is exactly what it sounds like: a user clicks a link in the search results that takes them from Google to your website. This is the metric that translates directly into website traffic. Clicks are the result of having a good position and a compelling search snippet. If you have a high average position and many impressions but very few clicks, it signals a disconnect. Your page title might not match the user's query, or your meta description fails to communicate the value of your content. Tools like MEGA AI's Maintenance Agent can help by automatically updating content to improve its click-through rate from search results.
How Google Calculates Average Position
Google calculates this average across every single time your URL appears in a search result for a given query. This includes instances where your page might show up on page 10 for a moment while Google is testing SERP layouts. These brief, low-ranking appearances can pull your average position down, even if you consistently rank in the top five. The calculation also accounts for various SERP features, where position is counted from top to bottom, then left to right. Because the calculation includes all these variations, your average position for a single keyword might look worse than your typical performance.
The "Topmost" Position Rule
Google's calculation method has a specific rule: it only considers the highest position your site holds on a search results page for any given impression. For example, if your website appears in position 3 and again in position 8 on the same page for the same search, Google only records position 3 for that search. This "topmost" rank is then averaged with the topmost ranks from all other queries where your site appeared. This is a critical detail because it means the metric isn't diluted by multiple, lower-ranking links on the same page, giving you a clearer, albeit still averaged, signal of your best-performing placement for each search.
Weighted Averages vs. Simple Averages
The Average Position metric isn't a simple average; it's a weighted average. This means that rankings for queries with more impressions have a greater influence on the final number. Think of it this way: if your page ranks at position 2 for a popular term that gets 1,000 impressions, and at position 30 for a niche term with only 10 impressions, the position 2 ranking will heavily outweigh the lower one. This is why a sudden drop in your average position might not be from a slip in your main keywords, but from gaining visibility for many new, lower-ranking long-tail keywords. This weighting system makes the metric more representative of what users actually see.
How SERP Elements Get a Single Position
Search engine results pages are more than just a list of blue links. They contain various elements like image packs, video carousels, and "People Also Ask" boxes. Google assigns a single position number to each of these elements. If your website has multiple links within one element—for instance, three of your product images appear in an image carousel that is in the fourth position on the page—all three of those images are considered to be in position 4. This rule simplifies how rankings are counted for rich results, ensuring that a single, feature-rich placement doesn't unfairly skew the data by being counted as multiple different positions.
The Role of Canonical URLs in Reporting
Websites often have multiple versions of the same page, such as separate URLs for mobile and desktop or pages with tracking parameters. To avoid confusion, Google selects one canonical URL to represent all of these variations. All performance data—including clicks, impressions, and position—for every version of that page is consolidated and assigned to this single, primary URL. This simplifies your reporting, as you don't need to manually combine data from different URLs to understand how a single piece of content is performing. It ensures that the data you see in Google Search Console reflects the total visibility of the content, regardless of how users accessed it.
Common Misconceptions About Average Position
The most common mistake is assuming a "good" average position automatically translates to high traffic. A high rank is often misleading if your impressions and click-through rate (CTR) are low. This happens because the average position is unweighted; an impression at position 3 doesn't count more than a fleeting impression at position 50. This can skew the data significantly. The metric isn't useless, but its value comes from tracking trends over time for your most important queries. Rather than fixating on the number, use it to see if your rank for key terms is generally improving, staying flat, or declining. Tools that offer a more complete picture of your SEO performance can help you connect position to actual business results.
Understanding the Four Types of Average Position
To get past the limitations of the single average position metric, you need to break it down. Google Search Console actually offers four different ways to look at your average position, each providing a different level of detail. Understanding these distinctions is key to finding actionable insights instead of getting misled by broad averages. When you learn to separate the signal from the noise, you can start making smarter decisions about where to focus your SEO efforts. Let's look at each one to see how you can use them to get a clearer picture of your performance.
Site Average Position (SAP)
Site Average Position (SAP) is the broadest view you can get. It’s the default metric you see in Google Search Console, representing the average position for all pages on your site across all the search terms you rank for. Think of it as a 30,000-foot overview of your entire website's visibility. While it can offer a quick, directional glance at your site’s overall health, it’s often too general to be truly useful. A single high-ranking page can mask hundreds of low-ranking ones, or vice-versa, making the SAP a potentially deceptive number for making strategic decisions about your content or technical SEO.
Page Average Position (PAP)
Page Average Position (PAP) offers a more focused perspective. This metric calculates the average position for a single page across all the search terms that lead users to it. This is much more helpful for diagnosing performance. For example, you can isolate a specific blog post or service page to see how it’s performing in search results. If a key landing page has a poor PAP, you know it needs attention. This allows you to audit your content and identify which pages are your SEO workhorses and which ones are falling behind, giving you a clear starting point for optimization.
Query Average Position (QAP)
Query Average Position (QAP) flips the focus. Instead of looking at a page, it shows the average position for a single search term across all the pages on your site that rank for it. This can be useful for understanding your website's authority on a particular topic. However, it can also be misleading. If you have two or three pages ranking for the same keyword—a situation known as keyword cannibalization—the QAP will blend their positions together. This can hide the fact that your most important page for that query is actually ranking lower than you think, preventing you from addressing the underlying issue.
Query Page Average Position (QPAP): The Most Accurate Metric
The most accurate and actionable metric is the Query Page Average Position (QPAP). This is the number you should care about most because it isolates the performance of one specific page for one specific search term. Since there are no other variables involved, a change in QPAP directly reflects a change in performance. If the number goes down, your rank improved. If it goes up, your rank dropped. Tracking the QPAP for your most valuable keywords is the best way to measure the real impact of your SEO efforts. This granular tracking is where end-to-end SEO tools become essential, as they can monitor these specific rankings automatically and connect them to business outcomes.
The Impact of New and Lost Queries
Finally, it's important to understand how new and lost queries affect your averages. When your site starts ranking for a brand-new term, even if it's on page eight, that "new query" gets factored into your SAP and PAP. This can drag your average position down, making it seem like your performance has declined when you've actually expanded your reach. Similarly, if you stop ranking for a low-position term, your average might improve, giving you a false sense of progress. This is another reason why the broader averages can be unreliable indicators of your true SEO performance and why focusing on specific, high-value queries is a much better strategy.
Why You Shouldn't Rely on Average Position Alone
While the average position metric in Google Search Console seems like a straightforward grade for your SEO efforts, it often paints an incomplete and even deceptive picture. Relying on it as your primary key performance indicator can lead you to focus on the wrong things. The number is an aggregation of all your rankings—the good, the bad, and the irrelevant—blended into a single, often unhelpful figure. To make truly data-driven decisions, you need to understand what this metric hides and why a more nuanced approach is necessary for an effective SEO strategy. Let's break down the key reasons why your average position can be misleading.
Why Averages Can Hide Important Details
The main issue with average position is that it’s an average. It smooths out the critical highs and lows that tell the real story of your performance. For example, an average position of 15 could mean your site consistently ranks on the second page for all its keywords. Or, it could mean you hold the #1 spot for a few high-value keywords and rank at #29 for many others. These two scenarios require completely different strategies, but the average position metric makes them look identical. As Google’s own Performance report documentation explains, it’s the average ranking for all impressions, which masks the performance of individual queries that actually drive your business.
How Growth Can Lower Your Average Position
It might sound strange, but a dropping average position can actually be a good sign. As your website grows and your content strategy matures, Google will start to test your pages for a much broader set of keywords. This means you'll begin to show up for more random searches and long-tail queries where you previously had no visibility. While this is a positive signal of expanding reach, these new impressions often start on page three, four, or even lower. Because the average position metric includes every single impression, these new, lower rankings can pull your overall average down, masking the fact that your core, high-value keywords are actually improving. This is why it's so important to track the keywords that matter and not get distracted by the site-wide average.
How Search Query Variations Affect Your Data
Your website likely ranks for thousands of different search queries, many of which you may not even be intentionally targeting. These can include long-tail variations, branded searches, and even irrelevant terms where your site briefly appears on page eight. Every single one of these impressions, no matter how insignificant, gets factored into your average position. A large number of low-ranking, low-volume keywords can easily drag down your overall average, making it seem like your core keywords are performing worse than they actually are. This noise makes it difficult to gauge the success of your targeted SEO campaigns without filtering the data to focus on the queries that matter most.
Why a High Rank Doesn't Guarantee Visibility
Ranking high isn't the same as being seen. A top-five average position might feel like a win, but it’s a hollow victory if those keywords have little to no search volume. If nobody is searching for the terms you rank for, you won't get impressions or clicks, rendering the high position meaningless. Furthermore, today's search engine results pages (SERPs) are crowded with features like ads, featured snippets, image packs, and "People Also Ask" boxes. These elements can push the #1 organic result far down the page, especially on mobile devices. A high ranking doesn't guarantee visibility above the fold, which is why it's crucial to analyze position alongside impressions and click-through rate (CTR).
Understanding the Link Between Position and Impressions
Position and impressions are closely related, but the relationship isn't linear. The difference in visibility and traffic between position 1 and position 3 is massive. However, the difference between position 21 and position 23 is practically zero. The average position metric treats these two scenarios with equal weight, failing to capture the true impact of your ranking changes. A small drop on the first page can decimate your impressions, while a significant jump on the third page might go completely unnoticed. This is why focusing on moving keywords from page two to page one—or from position 5 to position 1—is far more valuable than trying to improve your overall average position.
How to Read Your Average Position Data the Right Way
Average position is a flawed metric on its own, but that doesn't mean all position data is useless. The key is to add context. By looking at your rankings alongside other metrics, for specific queries, and with an understanding of the search results page, you can get a much clearer picture of your SEO performance.
Look at the Bigger Picture, Not Just One Metric
The average position number in Google Search Console isn’t a particularly useful standalone KPI. It’s simply the average rank of your site across all the queries you appear for. A better approach is to analyze position alongside impressions, clicks, and click-through rate (CTR). A high average position means very little if it’s not driving traffic. A good position is only valuable if it encourages users to click, which is why understanding the relationship between these metrics is key to measuring the true impact of your SEO.
Analyze Performance for Specific Queries
An unweighted average across thousands of queries hides what’s happening with your most important keywords. Tracking trends for key queries over time offers far more valuable insights. Instead of looking at the overall average, filter your performance report to see the position for your specific, high-intent keywords. You might find your overall average is 20, but you’re in the top 5 for terms that actually drive conversions. This focus on specific queries gives you a much more accurate measure of success and a clearer path for improvement.
Consider How Device and Location Affect Rankings
Your website’s ranking changes based on who is searching and where they are. A user on a mobile device may see different results than someone on a desktop. These nuances help explain why a high average position might not translate to high impressions or CTR. Use the filters in Google Search Console to segment your performance data by device and country. This allows you to spot potential issues, like poor mobile rankings, and helps you tailor your strategy to the specific contexts in which your audience is searching.
How Google Personalizes Search Results
Google doesn’t show a universal set of search results; it tailors what you see based on several personal factors. Your past search history, your physical location, and the device you're using all influence the rankings Google presents. This is why your personal search results often show a different position than the average reported in Google Search Console. For example, if you frequently visit a competitor's blog, Google might rank it higher for you in future searches. This level of personalization means there is no single, static ranking for any given keyword. The average position metric is just that—an average of all the different positions your site appeared in across countless unique, personalized searches from different users.
How SERP Features Affect Your Position
Ranking in "position two" doesn't guarantee you're the second link a user sees. Today's search results are crowded with features like ads, featured snippets, and image packs, all of which can push organic results down the page. It’s essential to manually check the SERPs for your most important keywords to get a real-world view of your visibility. This helps you identify opportunities, showing that aiming for a featured snippet might be more valuable than a simple number one ranking.
What Causes Your Average Position to Fluctuate?
Seeing your average position bounce around can be unsettling, but it’s a completely normal part of SEO. Your website doesn’t exist in a vacuum. Its performance is influenced by a dynamic digital environment where search engines, competitors, and users are constantly changing. Understanding these external factors is the first step to interpreting your position data correctly and making smarter decisions.
Instead of panicking when you see a drop, it’s more productive to investigate the potential causes. Fluctuations are often signs of broader shifts in the search landscape. They can be triggered by a major Google update, a change in how people are searching for your products, or even a new competitor entering the scene. By recognizing what causes these changes, you can adapt your strategy, protect your rankings, and find new opportunities for growth. The following are four of the most common reasons your average position changes.
How Google's Algorithm Updates Change Your Rank
One of the most significant reasons for a sudden shift in your average position is a Google algorithm update. Google is constantly refining its systems to provide better, more relevant search results. While small tweaks happen daily, larger core updates can roll out several times a year, fundamentally changing the criteria for how pages are ranked.
When an update occurs, you might see your rankings improve or decline, even if you haven’t made any changes to your site. This is because Google has adjusted the value it places on certain ranking factors. An update might prioritize pages with better user experience, more in-depth content, or a stronger backlink profile. Staying on top of these changes is key, and tools like MEGA AI's Maintenance Agent can help by automatically re-optimizing your content to align with new algorithm standards.
How Seasonal Search Behavior Impacts Your Data
User interest isn't static; it often follows predictable patterns throughout the year. These seasonal trends can have a direct impact on search volume and, consequently, your average position. For example, a retailer selling ski equipment will likely see search interest and competition for keywords like "best winter jackets" spike in the fall and winter. During these peak times, more competitors are active, which can push your average position down.
Conversely, your position might appear to improve during the off-season simply because there's less competition. You can use tools like Google Trends to identify these patterns for your industry. Understanding your business's seasonal cycles helps you set realistic expectations for your performance and plan your content and marketing campaigns more effectively.
Changes in Your Content's Relevance Over Time
What users consider relevant and helpful today might not be the same next year. User intent evolves, and new information becomes available, which can make once-authoritative content feel dated. If your content no longer aligns with the current needs and questions of your audience, your average position is likely to decline over time as more current resources take its place.
For instance, an article about the "best smartphones of 2022" is no longer relevant to someone searching that query now. To maintain a strong position, you must regularly update your content to reflect the latest information, trends, and user expectations. This means refreshing data, adding new sections to address emerging questions, and ensuring your page provides the most comprehensive answer available. This is where automated SEO tools can be a huge help, identifying content decay and suggesting updates.
How Shifting User Behavior Affects Your Rankings
The way people search is constantly changing. The rise of voice search, the influence of social media, and shifts in consumer culture all contribute to new search queries and patterns. People may start using different terminology, asking more complex questions, or searching for different types of content formats, like video instead of text.
If you aren't adapting to these shifts in user behavior, your content may lose visibility for key topics. For example, users might move from searching "how to fix a leaky faucet" to "video of leaky faucet repair." Monitoring how your target audience talks about their problems and what they're looking for is essential. This allows you to adapt your keyword strategy and content formats to meet them where they are, ensuring you remain visible in the search results that matter most.
The Impact of Content Quality and User Engagement
Beyond algorithm updates and competitor actions, your own content and the experience you offer visitors play a massive role in your search performance. Google’s primary goal is to satisfy the user’s query with the best possible answer. If your content is outdated, irrelevant, or fails to engage the reader, your rankings will suffer, regardless of other factors. Focusing on content quality isn't just about pleasing an algorithm; it's about serving your audience. When you provide genuine value, you send positive signals to search engines that your page is a worthy result. This section covers how content freshness, user engagement, and smart keyword targeting directly influence your average position.
Content Freshness and Regular Updates
Search engines prioritize content that is current and accurate. If your content no longer aligns with the present needs and questions of your audience, your average position will likely decline as more up-to-date resources take its place. This doesn't mean you need to constantly publish new articles. Instead, focus on maintaining the relevance of your existing pages. For example, a guide on tax laws for small businesses needs to be updated annually to remain useful. Regularly refreshing your content with the latest information, trends, and user expectations is essential for maintaining a strong position. This is where automated SEO tools can be invaluable, helping you identify pages with decaying relevance and suggesting updates to keep them fresh.
User Engagement Signals: Dwell Time and Bounce Rate
What happens after a user clicks on your link is just as important as getting the click itself. Google pays attention to user engagement signals like dwell time (how long a visitor stays on your page) and bounce rate (the percentage of visitors who leave after viewing only one page). If a user clicks your result and immediately returns to the search page, it signals that your content didn't answer their question. This can hurt your rankings over time. A high rank is often misleading if your impressions and click-through rate (CTR) are low, but it's even more problematic if the traffic you do get doesn't stick around. Creating high-quality, engaging content that encourages visitors to stay and explore is a powerful way to show Google your page is a valuable resource.
Targeting Long-Tail Keywords
Instead of focusing on broad, highly competitive keywords, targeting long-tail keywords can significantly improve your engagement metrics and rankings. Long-tail keywords are longer, more specific search phrases that users type when they are closer to making a purchase or finding a specific answer. For example, instead of "local bakery," a long-tail keyword might be "best gluten-free birthday cakes in Brooklyn." While these terms have lower search volume, they carry much higher intent. Creating content that directly answers these specific queries leads to a better user experience, lower bounce rates, and a stronger signal to Google that your page is highly relevant for that topic. Focusing on these high-intent keywords gives you a more accurate measure of your SEO success.
How to Build Your Position Analysis Strategy
Relying on the single average position metric is like trying to understand a whole story by reading one sentence out of context. To get a true picture of your SEO performance, you need a strategy that layers different data points to reveal what’s actually happening. Building a simple, repeatable analysis process will help you move from confusion to clarity and make decisions that genuinely improve your search visibility. It starts with setting the right foundation and then digging into the details that matter.
Establish Your Performance Baseline
Before you even look at your average position, establish a baseline with more reliable metrics. The average position number in Google Search Console can be misleading because it averages out all your rankings, from page one to page ten. As one expert puts it, this number is often absolute rubbish when viewed in isolation. Instead, start with total clicks and total impressions. These two metrics tell a clearer story: how many people are visiting your site from search and how many times your site appeared in the results. This foundation gives you a real-world measure of your current performance, providing the context you need before analyzing where you rank.
Segment Your Data to Find Actionable Insights
A single average position number hides the important details. The key is to segment your data to understand performance for specific areas of your site. In Google Search Console, you can filter your performance report by queries, pages, devices, and countries. This helps explain why a seemingly high average position might not translate to more traffic. You might discover your brand name ranks at position 1, inflating your average, while your most important non-branded keywords are stuck on page three. These nuances are critical for finding real opportunities and understanding where your SEO efforts are actually paying off.
Track Performance Trends Over Time
A single snapshot of your average position is far less useful than observing its movement over time. While the metric itself is unweighted, tracking trends for key queries can provide valuable signals. Is your average position for a specific group of commercial keywords slowly declining month over month? That’s an actionable insight. Look at your data over 30, 60, or 90-day periods to identify meaningful patterns rather than reacting to small, daily fluctuations. This long-term view helps you see the bigger picture and determine if your SEO strategy is moving in the right direction or needs a course correction.
How Often Should You Check Average Position?
Checking your average position daily is not a productive use of your time. The number will naturally fluctuate due to minor algorithm shifts and changes in search behavior. Reacting to these small, daily movements can lead to unnecessary stress and reactive changes that don't serve your long-term goals. A more effective schedule is to review your position data on a weekly or monthly basis. This allows you to see beyond the daily noise and identify meaningful trends. When you look at your data over several weeks, you can clearly see if your average position for key queries is improving, holding steady, or declining. This is the kind of information that helps you validate your SEO strategy and make informed decisions about where to focus your efforts next.
Find the Right Tools to Track Performance
Google Search Console is an essential starting point, giving you core data on clicks, impressions, CTR, and average position. However, manually segmenting and tracking this data over time can be a heavy lift. To make data-driven decisions efficiently, you need tools that can automate the analysis. An end-to-end SEO platform can connect directly to your GSC data, automatically monitor keyword trends, and identify which content needs updates to improve its rank and CTR. This approach saves you time and surfaces insights you might have missed, allowing you to focus on implementing strategic changes rather than getting lost in the data.
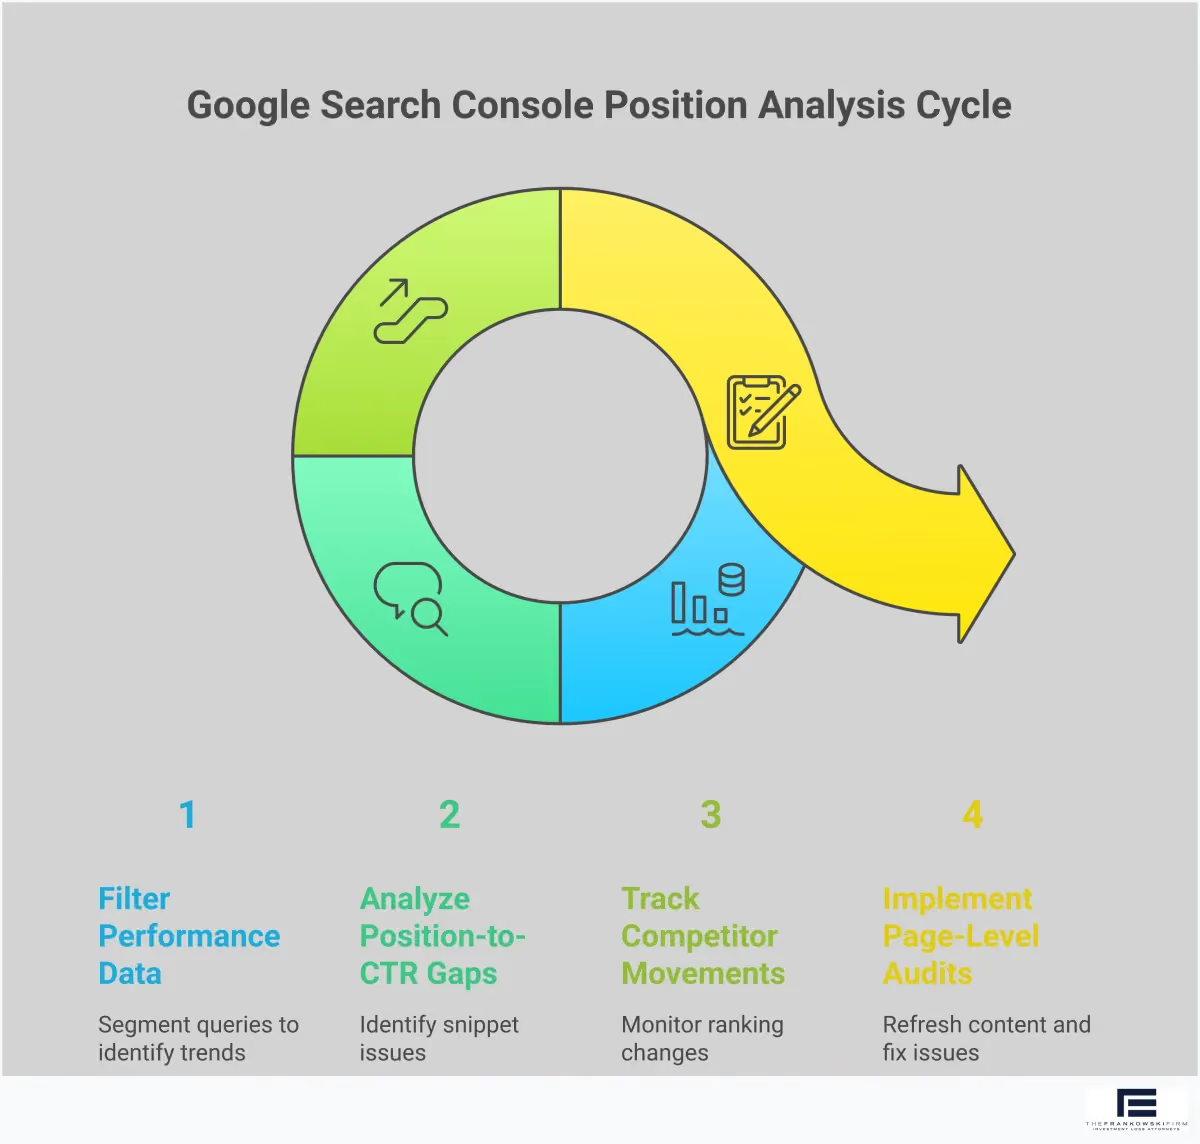
How to Use Position Data to Inform Your SEO Strategy
Once you understand what the average position metric is and how to interpret it, you can use it to make smarter choices for your SEO strategy. The goal isn't just to watch the numbers go up or down; it's to use the data as a signal for what to do next. By combining position data with other metrics, you can move from simply observing your performance to actively improving it. This involves identifying which pages and queries need attention, implementing targeted changes, and then measuring the results of your work.
Find Out What's Actually Driving Performance
The average position number you see on your main Google Search Console dashboard can be tempting to focus on, but it rarely tells the whole story. According to Google, it’s the average ranking of your site across all the queries it appears for. This means a few high-ranking keywords can be averaged with hundreds of low-ranking ones, giving you a number that isn't very useful. To find your true performance, you need to dig deeper. Filter your GSC reports to look at the position of individual pages or specific, high-value queries. This is where you’ll find actionable insights, not in the blended site-wide average.
Turn Your Insights into Strategic SEO Changes
A high average position doesn't always translate to high traffic. As some SEOs have noted, you can have a "high average position" while your impressions and click-through rate (CTR) remain low. This often happens when your page ranks well but the title tag or meta description doesn't compel users to click. Instead of overhauling the content, a strategic change might be to rewrite your SERP snippet. Tools that help improve your CTR can automate this process by testing different headlines to find what resonates most with searchers, turning good rankings into actual website visitors.
Using AI to Maintain and Optimize Content
If your content no longer aligns with the current needs of your audience, your average position will decline as more current resources take its place. Manually tracking every article for this "content decay" is a huge task, especially for small business owners. This is where automated tools can make a significant difference. Platforms like MEGA AI use AI to handle this process for you. Our Maintenance Agent, for example, connects to your site data to identify which articles are losing relevance. It then suggests new sections to add to make your content more comprehensive and can re-optimize your existing posts to improve their rank and click-through rate (CTR), ensuring your content stays fresh and competitive without constant manual effort.
Measure the Results of Your SEO Efforts
While the overall average position can be misleading, tracking the position trends for your most important queries over time is incredibly valuable. This is how you measure the real impact of your SEO efforts. After you publish a new blog post or update an old one, monitor its target keywords. Did their position improve? Did that improvement lead to more clicks and impressions? By focusing on these specific trends, you can confirm whether your changes are working. This approach allows you to double down on successful tactics and adjust strategies that aren't delivering results.
Link Your Findings to Your Technical SEO
Your site's position in search results is tied directly to its technical health. A sudden drop in rankings across several keywords might not be a content problem; it could be a sign of a technical issue. For example, a slow page load time, crawl errors, or mobile usability problems can all hurt your position. When you see an unexpected change in your average position, it’s a good practice to run a technical SEO audit. Analyzing position data alongside technical metrics gives you a complete picture of your site’s performance and helps you find the true root cause of any issues.
The "Plumbing" Analogy for Internal and External Links
Think of your website’s link structure as its plumbing system. Internal links are the pipes that distribute authority—or "link equity"—from your strongest pages to others, ensuring every room gets water. External links from other sites are the main water line bringing that authority in. If this system has leaks, like broken links, or blockages from poor internal linking, that authority gets wasted and doesn't flow correctly. Important pages won't get the support they need to rank. Just as a single average position number hides the important details of your keyword performance, a surface-level check can miss these critical structural problems that are holding your site back from its full potential.
Advanced Techniques for Analyzing Average Position
Average position is just one piece of the puzzle. To get a full picture of your SEO performance, you need to look at how this metric interacts with other data points. By digging a little deeper, you can move from simply observing your rank to understanding what drives it and how to improve it strategically. This approach helps you find actionable insights that can genuinely influence your search visibility.
How to Link Average Position to Click-Through Rate (CTR)
A high rank doesn't mean much if no one clicks on your link. That's why you should always analyze your average position alongside your click-through rate (CTR). These two metrics tell a story together. For instance, a high average position with a low CTR could signal that your title tag or meta description isn't compelling enough to earn the click. These nuances help explain why a "high average position... can sometimes be misleading when impressions and CTR remain low." By understanding CTR, you can better diagnose why users are—or aren't—clicking on your content from the search results page.
Compare Your Rankings to the Competition
While the site-wide average position can be a fuzzy metric, tracking your position for specific, high-value queries over time is incredibly useful. It gives you a benchmark for how you're performing against your direct competitors. If you see your position for a key term start to slip, it’s a good idea to check who is rising in the ranks. As one expert notes, while the metric is unweighted, "tracking trends for key queries over time still offers insights into how you compare against competitors." Using tools to monitor competitor rankings helps you stay informed and adapt your strategy proactively.
Analyze the Performance of Specific Pages
Instead of getting bogged down by the site-wide average, focus on the performance of individual pages. Filtering your Google Search Console data by URL gives you a much clearer and more actionable view. You can see the average position for a specific blog post or product page and the exact queries driving traffic to it. For example, you might find a case where a page has "26.9k total impressions... with an average CTR of 1% and an average position of 16." This kind of specific data helps you identify underperforming content. A page with a position hovering just outside the top 10 (e.g., 11-20) is often a prime candidate for a content refresh, as a small push could move it onto the first page and significantly increase its visibility.
Make Sure Your Content Aligns with Search Intent
Sometimes, a poor average position has less to do with your content quality and more with a mismatch in search intent. Your page might appear for a wide range of queries, including some that aren't a perfect fit. As one SEO expert explains, your average position "might look worse than your typical performance because of these random fluctuations and testing that Google does." If your content is an informational guide but the top-ranking results for a query are all ecommerce product pages, you're fighting an uphill battle. You need to ensure your content format and angle align with what searchers expect to see. Analyze the SERPs for your target keywords to understand the dominant intent—is it informational, commercial, transactional, or navigational? Then, adjust your content to match.